
By Blake Stretton, Gittoes Real Estate
Published October 2026, using market data through the end of September 2026.
The Central Coast property market in September 2026 showed more movement. The regional median sale price lifted and the typical selling time shortened compared with August. Across the campaigns I was involved in, buyers seemed more ready to make decisions, and some properties that had been sitting on the market found buyers.
Pricing still mattered. Buyers had more homes to compare, and the regional figures show sales landing further below listed prices on average.
Quick answer: September brought a higher Central Coast median sale price of $971,000 and a shorter median selling time of 43 days. However, available stock rose to 2,584 homes and sales averaged 3% below listed prices. Our experience at Gittoes was of more movement and decision-making, with competitively priced, move-in-ready homes attracting interest. Sellers still need to assess today’s competition carefully.
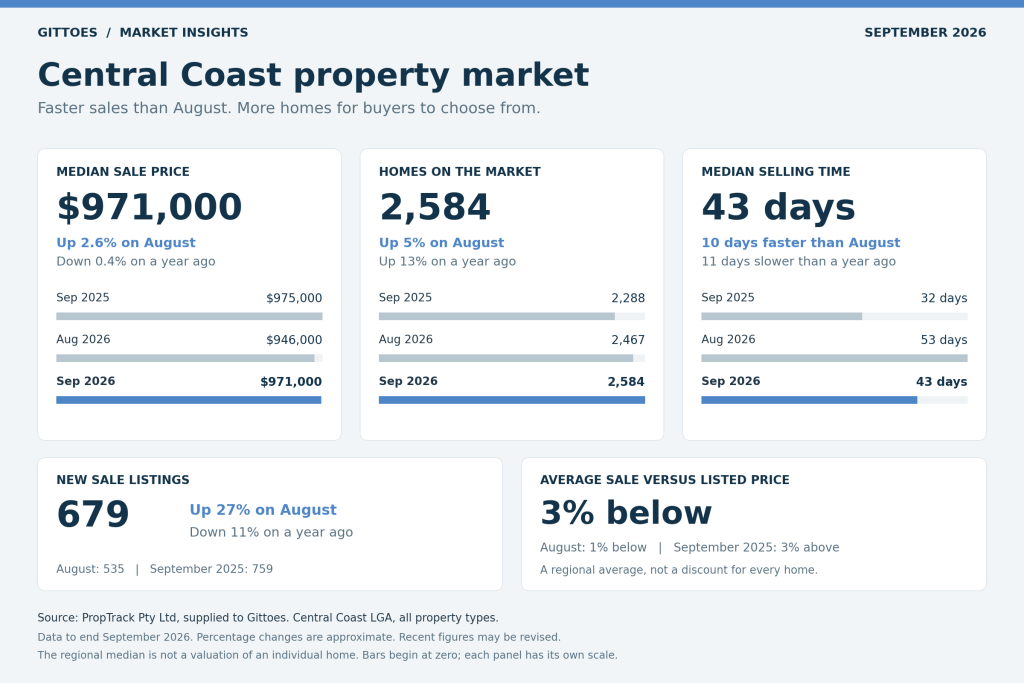
September’s Central Coast property market at a glance
- Median sale price: $971,000, up approximately 2.6% on August and approximately 0.4% below September 2025.
- Active listings: 2,584, up approximately 5% on August and 13% on a year ago.
- New sale listings: 679, up approximately 27% on August but 11% below September 2025.
- Median days on market: 43, compared with 53 in August and 32 a year earlier.
- Average sold versus listed price: 3% below, compared with 1% below in August and 3% above in September 2025.
These PropTrack figures cover the whole Central Coast local government area and all property types combined. Conditions can differ between suburbs, price brackets and individual homes.
A higher median and faster sales, with more competition for sellers
September’s median rose from $946,000 in August to $971,000, bringing it close to the $975,000 recorded a year earlier. It remained approximately 9% below February’s peak of $1,065,000.
A monthly median reflects the middle price of the properties sold. Changes in the mix of those properties can move the median, so these figures do not mean every home rose in value during September or has fallen 9% since February.
There is also a small revision to note: our August market update reported a median of $950,000. The latest data revises that figure to $946,000, which we use for this month’s comparison.
The fall in median selling time from 53 to 43 days is consistent with the greater movement I noticed in our campaigns. However, selling still took longer than a year ago, and active listings reached their highest level for the January-to-September period.
Together with sales averaging 3% below listed prices, that suggests conditions continue to favour buyers in terms of choice and negotiation. The regional average is not a standard discount to apply to every property.
Are slow property sales a sign of a real estate bubble?
Questions about slow real estate sales in Australia need local context. On the Central Coast, September’s median selling time was longer than a year earlier, but it improved from 53 days in August to 43 days. In our own campaigns, we also saw buyers making decisions and some longer-running listings selling.
These figures alone cannot establish whether there is a real estate bubble or predict a market crash. A higher number of homes for sale, longer selling times and negotiations below listed prices describe current selling conditions. They do not, by themselves, tell us what prices will do next.
For sellers, the useful question is how your property compares with recent local sales and the homes buyers can choose from today. That evidence is more relevant to your campaign than a broad national headline.
What our September open homes showed
Gittoes’ own records add another perspective. Across 62 recorded Saturday property openings in September, we registered 233 buyer-group attendances, averaging 3.8 groups per opening.
- 24 openings, approximately 39%: one or two buyer groups.
- 25 openings, approximately 40%: three or four buyer groups.
- 13 openings, approximately 21%: five or more buyer groups.
These are attendances, not unique buyers, and the figures cover our recorded Saturday opens rather than every inspection across the region.
For owners, the useful context is that an open home attracting one or two groups was not unusual within this sample. A quieter inspection alone does not tell you whether a campaign is working. The follow-up matters: are those buyers interested, how does the home compare with alternatives, and what is stopping them from making an offer?
Buyers were making decisions
During September, our office recorded 13 properties reaching unconditional status, representing more than $13.76 million in sales and an average sale price of approximately $1.06 million.
These are properties that became unconditional during the month, rather than necessarily being first agreed or settled in September. The figures demonstrate completed progress in our campaigns, but without a comparable August office total they do not establish a month-on-month increase in transactions.
My observation was that September felt better. There was more movement, buyers were making decisions, and some homes that had been sitting were selling.
We also saw several well-priced, move-in-ready properties sell within a week, with solid inspection attendance. Those campaigns did not necessarily produce two or three competing offers. In some cases, one committed buyer recognised the fit and made a decision.
That is an important distinction for sellers. A successful result does not always come with a crowded open home or multiple offers. It can come from reaching a suitable buyer, understanding their position and negotiating carefully.
What this means if you are selling or buying
For sellers, September offered encouragement that buyers were prepared to act. The practical priority is to position your home against what buyers can purchase today.
- Use recent comparable sales: assess homes similar to yours, alongside the properties currently competing for attention.
- Make presentation count: our recent experience with move-in-ready homes supports preparing thoughtfully. Our guide to selling in spring without overspending explains where to start.
- Review the whole campaign: consider enquiry, inspections, follow-up feedback and offers together, rather than reacting to one quiet Saturday.
- Assess a serious offer carefully: consider its price, conditions and timing against the evidence and your plans.
For buyers, increased choice creates more opportunity to compare properties. However, our experience with well-priced homes shows that a suitable property can still sell quickly. Being clear about your budget, requirements and readiness to proceed helps you respond when the right home appears.
A brief look at the rental market
The Central Coast median weekly rent was $670 in September, unchanged from August and approximately 3% above a year earlier. There were 776 recorded leased listings, up approximately 15% year on year.
That shows higher leasing activity alongside a steady monthly median rent. It does not establish vacancy rates or guarantee a particular rent for an individual property. Landlords should assess comparable rentals and their property’s condition when reviewing expectations.
September 2026 Central Coast Property Market Snapshot
What we are watching next
The next question is whether buyer activity keeps pace with the homes coming onto the market through spring. We will be watching available stock, selling times and the gap between listed and sold prices, alongside feedback from our own campaigns.
September showed more movement in our experience, while pricing remained central to getting a result. For a clearer view of where your property sits, speak with one of our agents at Gittoes Real Estate about recent local sales, competing listings and a strategy suited to your next move.
Sources and scope: Regional market figures are sourced from PropTrack Pty Ltd, Central Coast LGA, all property types, current to the end of September 2026, as supplied to Gittoes. Recent figures may be revised. Office attendance and unconditional sales figures are from Gittoes’ September records; campaign observations are from Blake Stretton. The early regional September sales count has not been used to draw conclusions about transaction growth.
What could your property achieve in today’s market?
Regional figures provide useful context, but your home’s likely selling price depends on its location, condition and the properties competing for buyers’ attention.
For advice tailored to your property, request an appraisal with Gittoes Real Estate. One of our local agents can discuss recent comparable sales, current buyer activity and a selling strategy suited to your plans.